Hypothesis Testing
Discussion
Required Resources
Read/review the following resources for this activity:
- Textbook: Chapter 9
- Lesson 7 Reading
- Minimum of 1 scholarly source AND one appropriate resource such as the textbook, math video and/or math website
In your reference for this assignment, be sure to include both your text/class materials AND your outside reading(s).
Initial Post Instructions
Describe a hypothesis test study that would help your work or conclusions in some way. Describe what variable would be tested and what would be your guess of the value of that variable. Then include how the result, if the null were rejected or not, might change your conclusions or actions in some way.
Follow-Up Post Instructions
Respond to at least one peer. Further the dialogue by providing more information and clarification.
Writing Requirements
- Minimum of 2 posts (1 initial & 1 follow-up)
- APA format for in-text citations and list of references
Grading
This activity will be graded using the Discussion Grading Rubric. Please review the following link:
- Link (webpage): Discussion Guidelines
Course Outcomes
CO 9: Given a sample dataset, construct and interpret the test of hypothesis for population mean or proportion.
Due Date
Due Date for Initial Post: By 11:59 p.m. MT Recommended by Wednesday
Due Date for Follow-Up Posts: By 11:59 p.m. MT on Sunday
Posts must be on two separate days.
Lab
Assignment
Required Resources
Read/review the following resources for this activity:
- OpenStax Textbook: Chapter 8
- Lesson
- Chamberlain University Library
- Week 7 Lab TemplateLinks to an external site.
Scenario/Summary
The highlight of this week’s lab is confidence intervals and the use of these intervals in the health sciences. There is a short reading that specifically relates confidence intervals to health sciences and then you are asked to demonstrate your knowledge of confidence intervals by applying them in a practical manner.
Prepare
- Download the Week 7 Lab Lecture Notes.Links to an external site.
Instructions
Steps to Complete the Week 7 Lab
Step 1: Find these articles in the Chamberlain Library. Once you click each link, you will be logged into the Library and then click on “PDF Full Text”.
- First Article: Confidence Intervals, Part 1 Links to an external site.
- Second Article: Confidence Intervals, Part 2 Links to an external site.
Step 2: Consider the use of confidence intervals in health sciences with these articles as inspiration and insights.
Step 3: Using the data you collected for the Week 5 Lab (heights of 10 different people that you work with plus the 10 heights provided by your instructor), discuss your method of collection for the values that you are using in your study (systematic, convenience, cluster, stratified, simple random). What are some faults with this type of data collection? What other types of data collection could you have used, and how might this have affected your study?
Step 4: Now use the Week 6 Spreadsheet to help you with calculations for the following questions/statements.
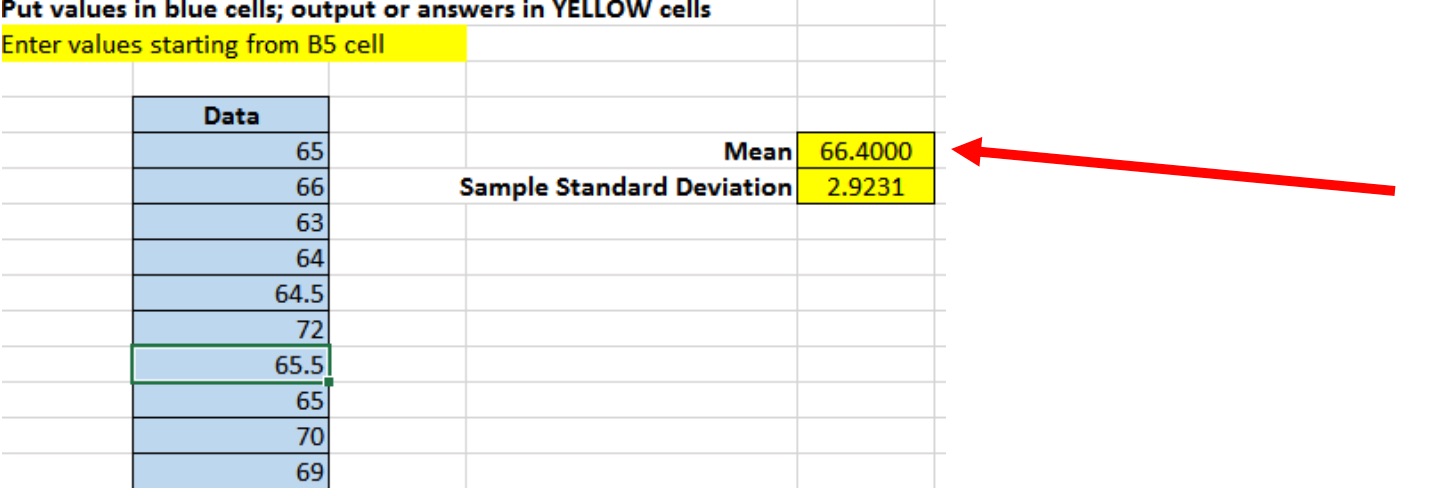
a) Give a point estimate (mean) for the average height of all people at the place where you work. Start by putting the 20 heights you are working with into the blue Data column of the spreadsheet. What is your point estimate, and what does this mean?

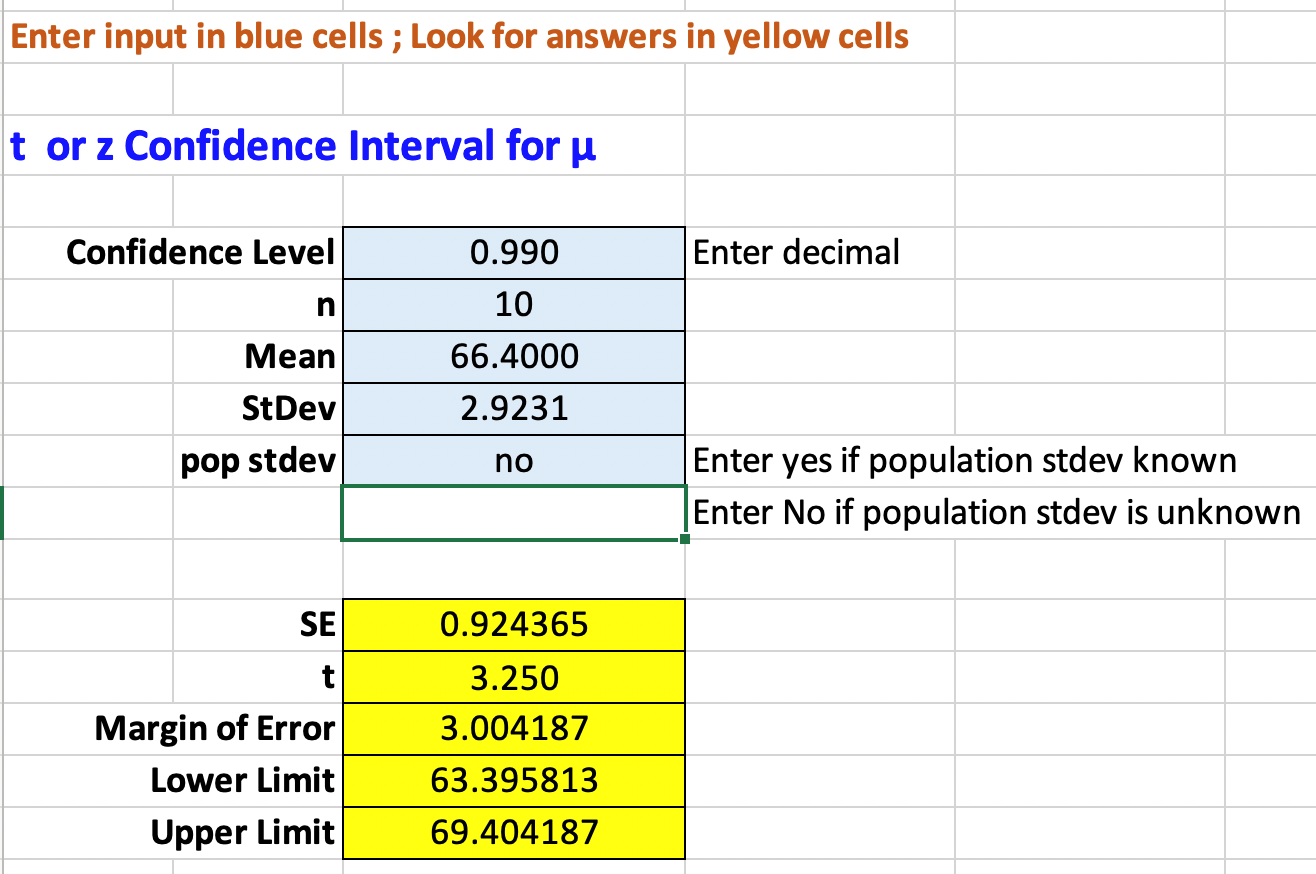
b) Find a 95% confidence interval for the true mean height of all the people at your place of work. What is the interval? [see screenshot below]
c) Give a practical interpretation of the interval you found in part b, and explain carefully what the output means. (For example, you might say, “I am 95% confident that the true mean height of all of the people in my company is between 64 inches and 68 inches”).
d) Post a screenshot of your work from the t value Confidence Interval for µ from the Confidence Interval tab on the Week 6 Excel spreadsheet

Step 5: Now, change your confidence level to 99% for the same data, and post a screenshot of this table, as well.

Step 6: Compare the margins of error from the two screenshots. Would the margin of error be larger or smaller for the 99% CI? Explain your reasoning.
Step 7: Save the Week 7 Lab document with your answers and include your name in the title.
Step 8: Submit the document.
Requirements
The deliverable is a Word document with your answers to the questions posed below based on the article you find.
Required Software
- Microsoft Word
- Internet access to read articles
Grading
This activity will be graded based on the Week 7 Lab Rubric.
Outcomes
CO 8: Given a sample dataset, estimate and interpret the confidence intervals for population mean or proportion.
Due Date
By 11:59 p.m. MT on Sunday
Rubric
| Criteria | Ratings | Pts | |||||
|---|---|---|---|---|---|---|---|
This criterion is linked to a Learning OutcomeData Collection and Pitfalls Range |
| 12 pts | |||||
This criterion is linked to a Learning OutcomeEstimate a Confidence Interval |
| 15 pts | |||||
This criterion is linked to a Learning OutcomeInterpret a Confidence Interval |
| 15 pts | |||||
This criterion is linked to a Learning OutcomeGrammar and Formatting |
| 8 pts | |||||
Total Points: 50 | |||||||
